Roles:
Art Direction
Graphic Design
Motion Design
Client:
John L. Scott
While on the John L. Scott Marketing team, I led a full rebrand of the Monthly Housing Updates over a three-month period. After creating and getting approval on the initial designs, I guided the team in building the remaining assets and developed custom scripts to streamline the production process. With my leadership and expertise, our team saved ~20hours of production time every month.
The Problem
The previous process was outdated, inflexible, and time-consuming. Although it utilized InDesign’s Data Merge for input for the main fliers, all custom styling—like color coding and graph creation—had to be done manually for each piece of material.
This process also repeats every month.
The Solution
Create a design system that is scalable, code-driven, and modern.
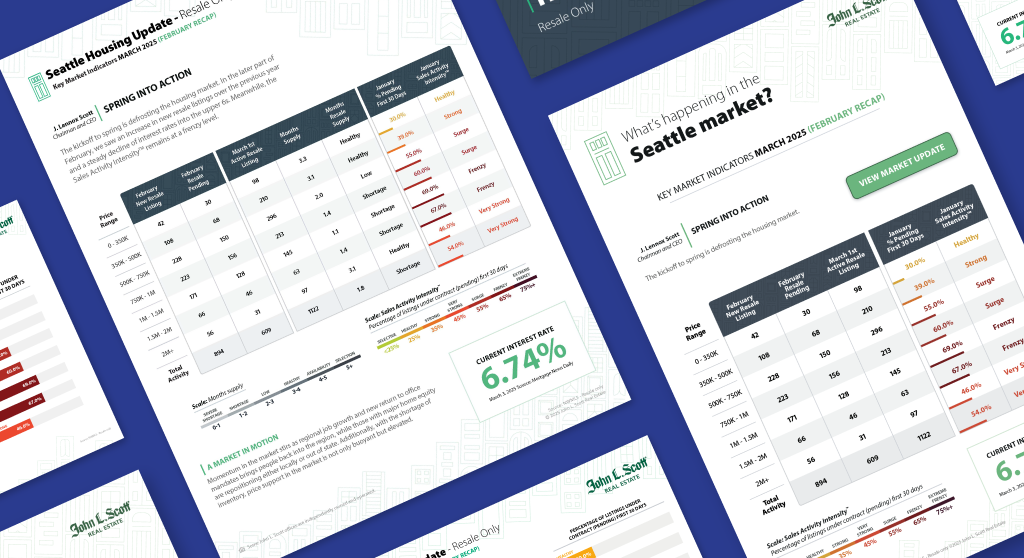
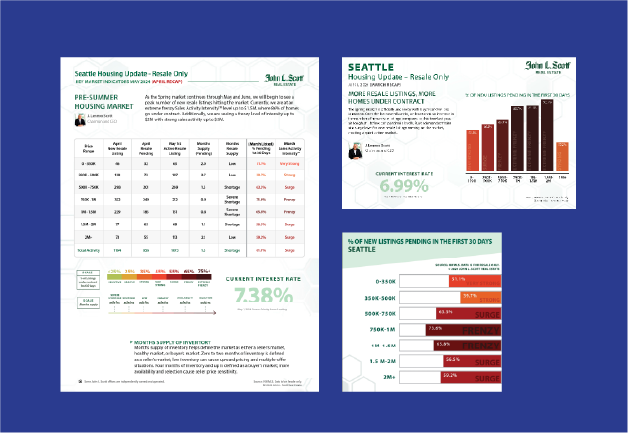
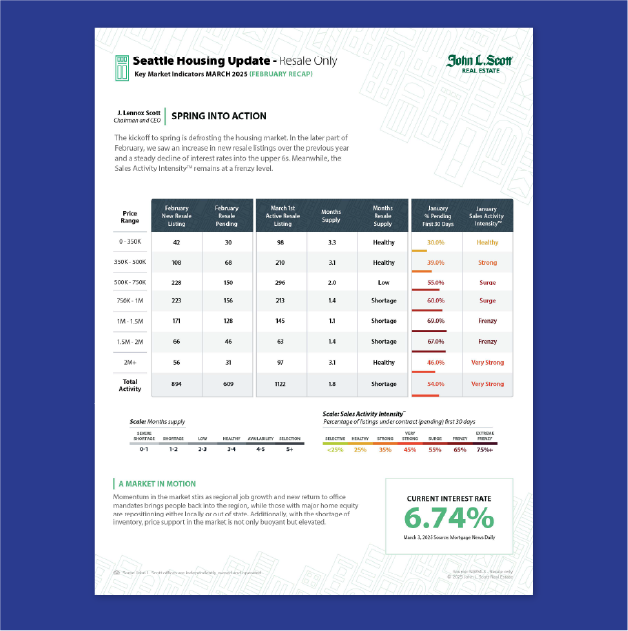
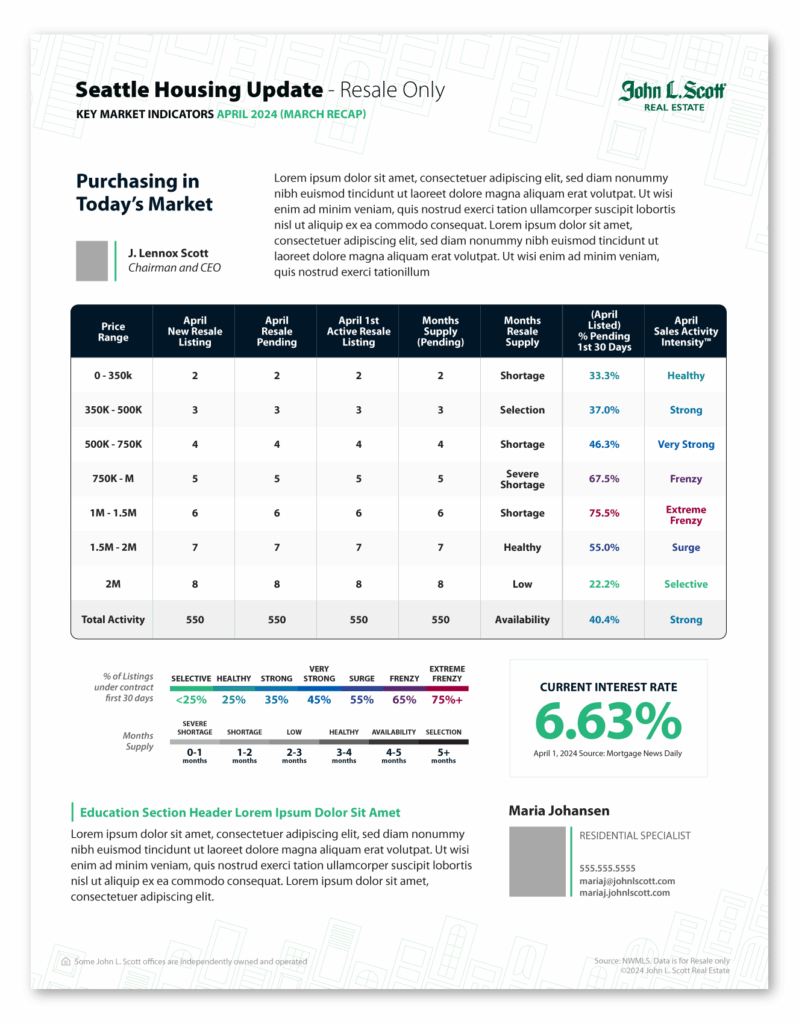
I designed a clean, eye-catching new layout focused on readability and flexibility, while introducing a new functional graph to the fliers. Using InDesign scripts and After Effects expressions, I built an automated, adaptable system from the ground up.
The Process
I began by breaking down the existing design into base sections, looking for ways to reorganize while adding functionality. The graph was a key pain point—it needed to be simplified without confusing regular readers with drastic changes.
Next, I explored new color-coding options to improve contrast and attempt to move away from harsh reds, which could be perceived as overly negative.
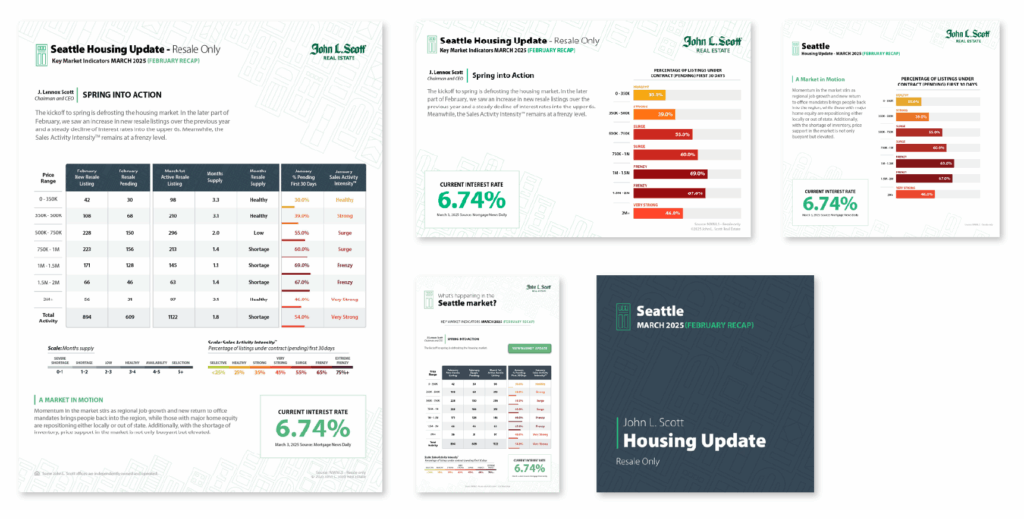
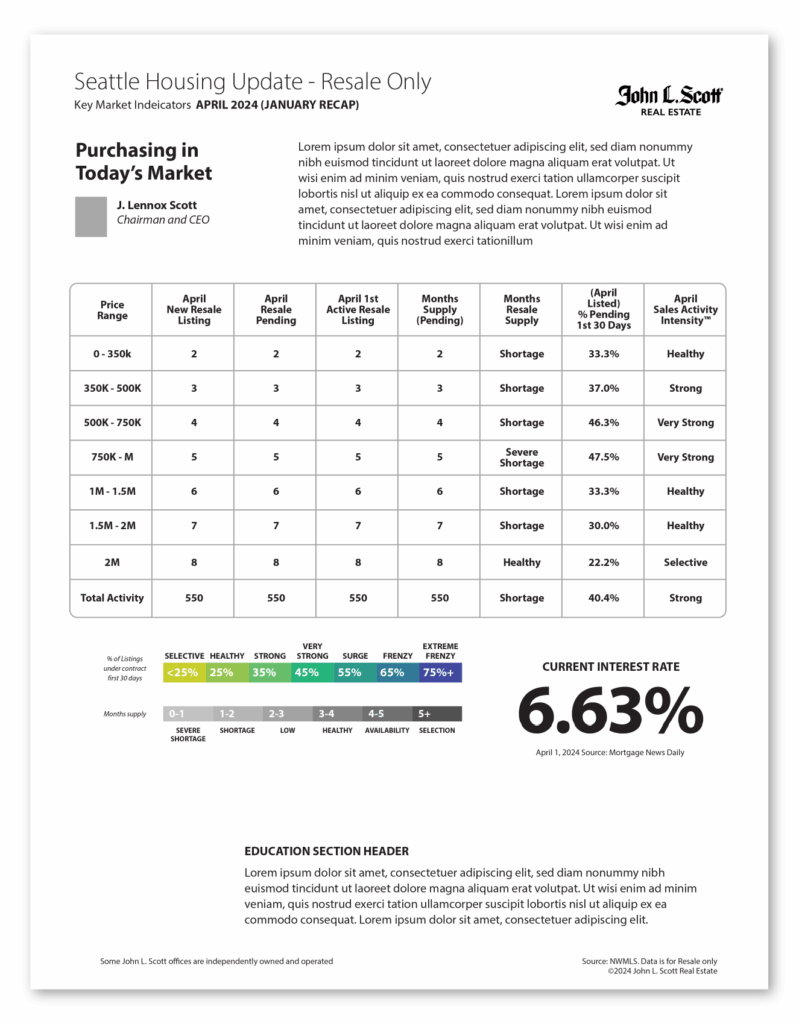
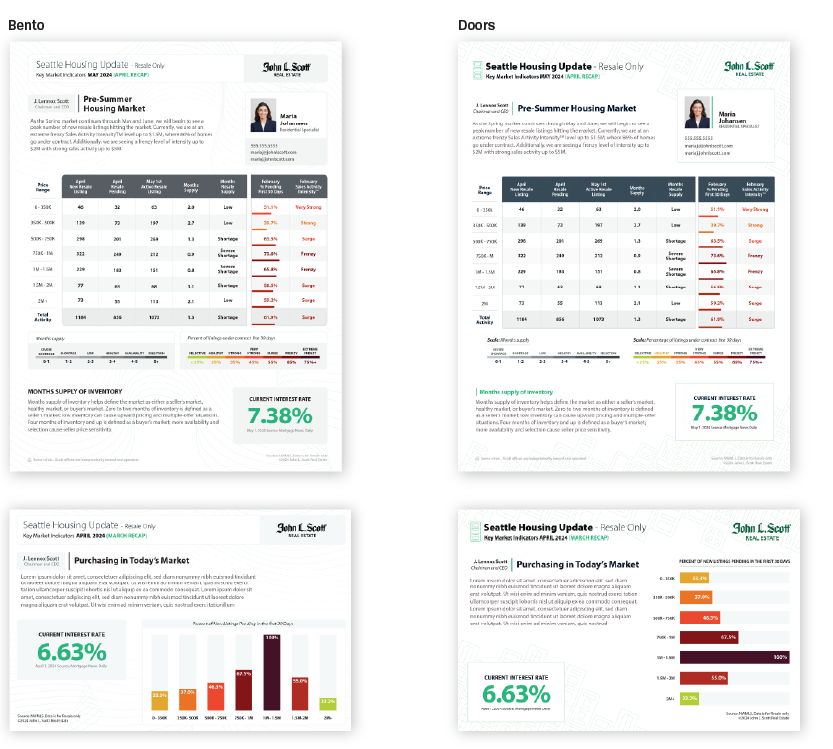
Starting Designs
Base
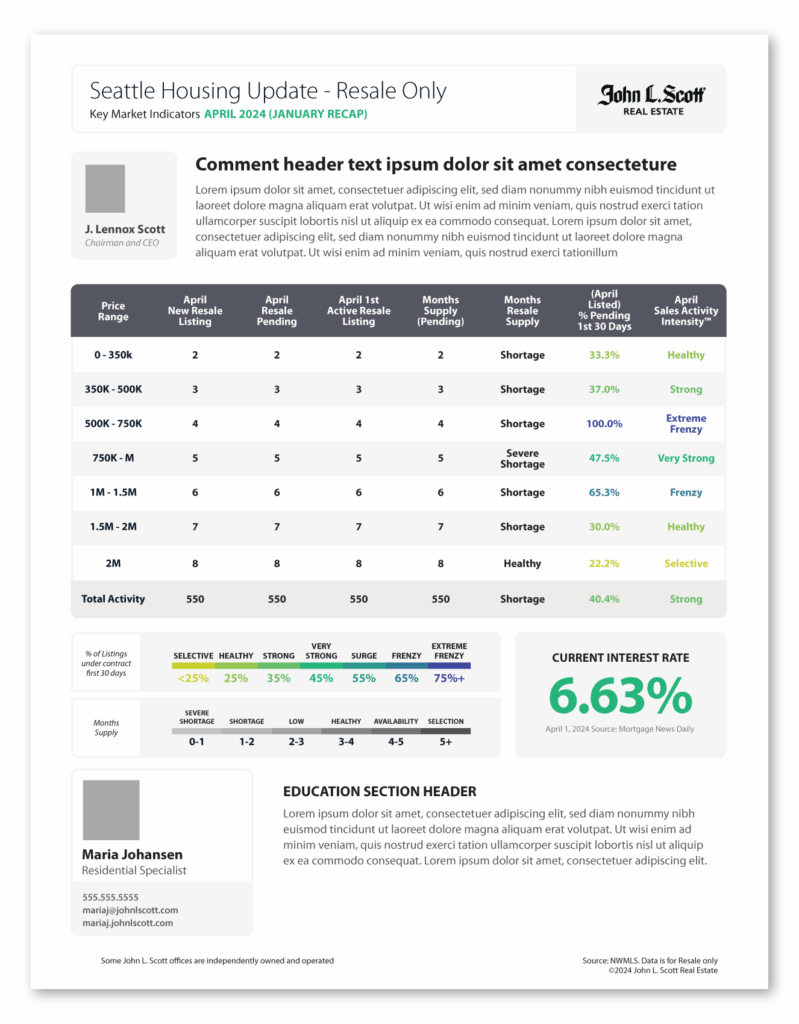
Bento
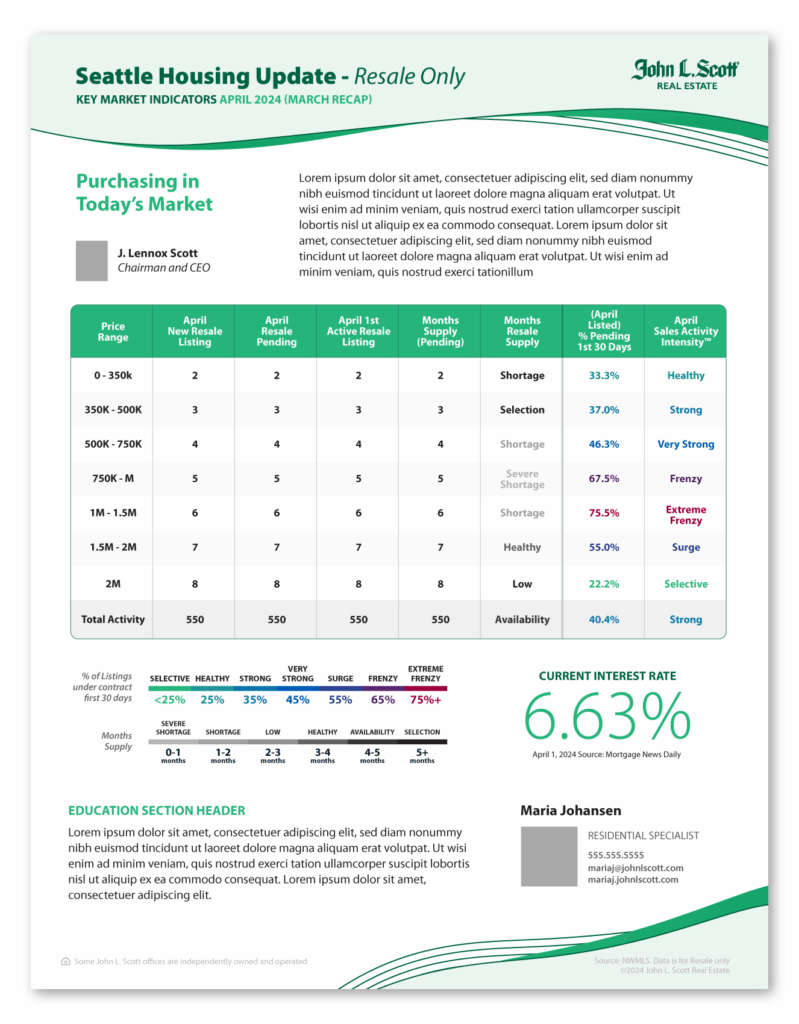
Waves
Doors
Color Options
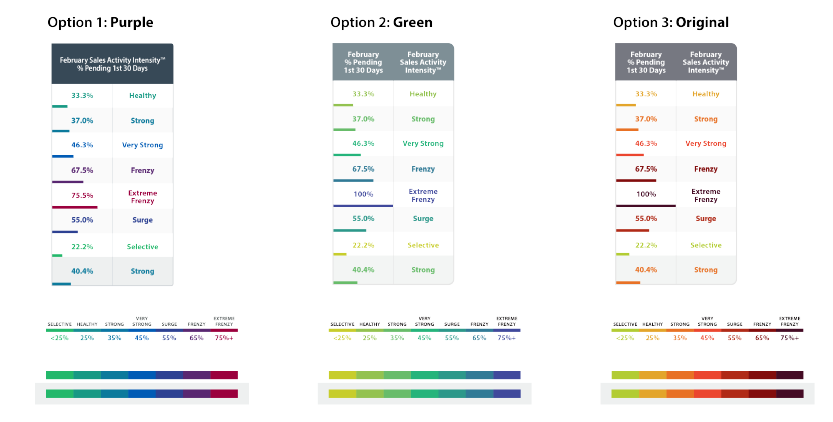
Final Option Samples
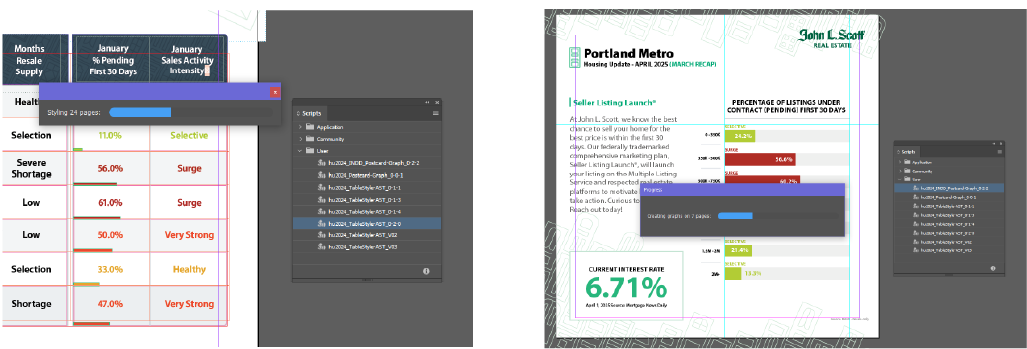
Code Driven
I created two different scripts to accomplish the most tedious of tasks – color coding percentages and intensities on every flyer, and creating graphs. The flyer script runs through every page in the document looking for the specific Intensity labels inside a table, determines the color and applies it to the adjacent cell, then scales a hidden rectangle based on percentage in the adjacent cell.
The second script is for the Postcards and Social media post. It first checks document which asset it is, then it reads data from a hidden table, custom formats and creates a graph based on that data, and color codes each bar.